This article was originally published on LinkedIn.
Introduction
Custom logging is something that I have been using extensively over the past years, when it comes to tracking properties in Logic Apps Standard workflows.
Logic Apps Consumption based and Standard both support tracking properties in workflow actions via its settings tab as shown in the following image.

The downside of this approach, at least for me, always has been that you need to write complex KQL queries to get the tracked properties out the multidimensional tables from Log Analytics or Application Insights. What didn’t help is that tracking properties could occur at any action in a workflow, and therefore it overcomplicated the queries that need to be written.
Back in 2019, I found an easier way to achieve a better, more granular approach to logging tracked properties to Log Analytics custom tables. And it came in the form of an out of the box action, called Send Data which used an API connection to interact with the Azure Monitor Data Collector API.
This approach has served many well over the past years and it worked smoothly. Nevertheless, the data collector API is being deprecated and will not longer be functional as of September 2026.
My assumption is that many organizations, teams and individuals that use Logic Apps, may be using the same approach for logging. And chances are that you’re not aware of the upcoming EOL. Hopefully this article will help you and ease the migration to the Microsoft preferred approach.
Problem and Context
Even though I remember reading about the Azure Monitor Data Collector API deprecation more than a year ago, I was under the assumption that Microsoft would release a new version of this action / change the existing implementation towards the Log Analytics Log Ingestion API.
A couple of months ago, my team started noticing strange behavior in the workflow run UI. We faced similar behavior a year before that time, which then was related to a bug in the workflow extension bundle. With a version update, the issue was gone.
But this one persisted for months. What made it worse: the UI in VS code also stopped working. As you can see in the image, the action itself works and the data is stored in the custom table in Log Analytics.

With some spare time, I thought we could fix this easily. While looking for a solution, I found this page and then it hit me. In less than 7 months, the approach that served me for years will stop working.
And that, my fellow readers, triggered a mild panic attack. Besides the workflow run history, we’re heavily depending on this monitoring approach for all our integrations. Each integration has its custom table to write traceable and trackable information. If this action starts failing, it will result in a run termination/failure in any workflow. And with more than 300 workflows in our integration landscape the impact can be considered as critical.
Therefore, it’s time to move to a supported and future proof solution as soon as possible.
Solution – Azure Monitor Log Ingestion API
If you followed the previous link in the problem description, you’ll find a link that outlines the steps that are needed to migrate from the Data Collection API to the Data Ingestion API.
Summarizing the information:
- Security Improvements: The underlying API connection data for the Send Data action always used the Log Analytics workspace id and the workspace key to authenticate the Azure Monitor Data Collector API with Log Analytics. You might have noticed that the workspace key of a Log Analytics workspace can’t be found anymore via the portal, but you can still retrieve it via arm/bicep which should be an indicator to move a better alternative. Reason to mention this is because the approach with the Azure Monitor Log Ingestion API uses managed identity authentication. This is a better approach from security perspective. As an alternative, one could also use an app registration to achieve the same.
- Migrate or recreate custom table(s): The classic Log Analytics custom tables that are currently in place can’t be reused. You either will need to recreate custom log tables (with a different name) or migrate them. My suggestion would be to keep existing tables as a fallback scenario and to keep your history. Create new ones for the MS preferred approach.
- Introduce a Azure Monitor Data Collection endpoint: A data collection endpoint (DCE) is an Azure resource that defines a unique set of endpoints related to data collection, configuration, and ingestion in Azure Monitor. To simplify, it is an Azure Resource that provides an ingestion HTTP endpoint. As a rule of thumb: Use a single DCE per integration to avoid issues like throughput or too many requests.
- Introduce one or more Azure Monitor Data Collection Rules: Data collection rules (DCRs) are part of an ETL-like data collection process that improves on legacy data collection methods for Azure Monitor. This process uses a common data ingestion strategy for all data sources and a standard method of configuration that’s more manageable and scalable than previous collection methods. In general, the DCR is the bridge between the DCE and your the custom table in Log Analytics. It provides a data source (the custom table) to stream the data to. In the DCR specific step I will explain why you might need more DCR’s.
- Logic App Standard managed identity authorization to the DCR: For the workflows to send requests to the DCR, the managed identity of a Logic Apps (Consumption/Standard) will need the Monitoring Metrics Publisher role on the DCR.
- Replacing the Send Data action from your workflow: Replacing the Send Data action with a HTTP action to post data to the DCE will be the most intensive part of the job. After this change, your workflow will send log information to the custom Log Analytics table through the Log Ingestion API.
When everything is in place, the solution looks like this:

Step 1: Create new tables in Log Analytics
As mentioned earlier, you should either migrate existing tables (classic) or create new ones that are compatible with this approach. In our situation we decided to keep the existing table as backup and historical purposes. To create new tables, the following bicep snippets can be used or changed to your own needs.
Please note that the TimeGenerated field is mandatory on all tables!
Preparation
var customTable = {
  name: 'Table1'
  columns: [
    { name: 'TimeGenerated', type: 'datetime' }
    { name: 'SupplierNumbers', type: 'string' }
    { name: 'InvoiceNumbers', type: 'string' }
  ]
}

module logAnalyticsCustomTable 'modules/log.analytics.custom.table.bicep' = {
  name: 'laws-custom-tables-${Configuration.integration.workload.integrationName}'
  scope: resourceGroup(resourceGroupName)
  dependsOn: [
    subnet
  ]
  params: {
    LogAnalyticsWorkspaceName: 'LogAnalyticsWorkspaceName'
    CustomTable: customTable
  }
}
The log.analytics.custom.table.bicep
@description('Log analytics workspace name.')
param LogAnalyticsWorkspaceName string

@description('Log analytics custom table object.')
param CustomTable object

// Create: log analytics custom logging table for logic app
resource logAnalyticsWorkspace 'Microsoft.OperationalInsights/workspaces@2025-07-01' existing = {
  name: LogAnalyticsWorkspaceName
}

resource logAnalyticsWorkspaceCustomTable 'Microsoft.OperationalInsights/workspaces/tables@2025-07-01' = {
    parent: logAnalyticsWorkspace
    name: 'log_${CustomTable.name}_CL'
    properties: {
      schema: {
        name: 'log_${CustomTable.name}_CL'
        columns: CustomTable.columns
      }
      retentionInDays: 30
    }
  }
Step 2: Create the Azure Monitor Data Collection Endpoint
After creating the table(s), the next step is to create the Azure Monitor Data Collection Endpoint. The following snippets show how to achieve this, it’s quite straightforward.
Preparation
// Region: custom data collector endpoint for log analytics
var dataCollectionEndpointName =  'A meaningful name for your data collection endpoint'
}

module dataCollectionEndpoint 'modules/data.collection.endpoint.bicep' = {
  name: 'dce-[deployment name]'
  dependsOn: [
    logAnalyticsCustomTable
  ]
  params: {
    DataCollectionEndpointName : dataCollectionEndpointName
  }
}
The data.collection.endpoint.bicep
@description('Optional location.')
param Location string = resourceGroup().location

@description('Data collection endpoint name.')
param DataCollectionEndpointName string

// Create data collection endpoint
resource dataCollectionEndpoint 'Microsoft.Insights/dataCollectionEndpoints@2024-03-11' = {
  name: DataCollectionEndpointName
  location: Location
  properties: {
    networkAcls: {
      publicNetworkAccess: 'Enabled'
    }
  }
}

// We need this information later on
output dataCollectionEndpoint object = {
  resourceName: dataCollectionEndpoint.name
  resourceId: dataCollectionEndpoint.id
}
Step 3: Create the Azure Monitor Data Collection Rule
This was difficult to implement. Normally I would click around in the portal and export the ARM template to get an idea on how to implement it in our codebase.
First things first: DCR cannot be created from the DCR user interface in the Azure portal
But when you just create a new DCR in the portal, you are not able to connect it properly to a log analytics custom table in a meaningful way.
You start with creation of the DCR

And in the tab “Collect and deliver” the challenge starts by adding a data source… While the Destination is straight forward, a log analytics workspace, the data source is not!

In short, none of the option provided will result in creation of the data source properly (the custom table).

And therefore, you need to go the other way around, creating the DCR from the Log Analytics Workspace Custom table page.
- Go to Log Analytics Workspace -> Tables
- Click on “Create” to create a new table of type “New custom log (Direct ingest”.

In the following screen:
- Take note of the 45-character limit, it will also apply to the names you use in your DCR
- Make sure to use the Analytics table plan. Basic won’t work in our scenario
- And use the link to Create a new data collection rule. You will only need to provide a name for the DCR, and everything will be magically created!
Long story short: the bicep
Now that I have created it successfully, I can export the DCR as ARM template and create a similar bicep from it. The bicep is complicated though.
- It has stream declarations, which is a reference of the data stream that reflects the custom table. Therefore, it needs to have a name and columns that exactly match the columns in the custom table itself. Luckily, we can reuse the variable declaration I did before to create the Log Analytics custom table.
- And there is a data flows section, which is a reference to the stream declaration, the destination (which is the Log Analytics workspace), and the output stream.
Preparation
// We reuse the table definition from earlier.
var customTable = {
  name: 'Table1'
  columns: [
    { name: 'TimeGenerated', type: 'datetime' }
    { name: 'SupplierNumbers', type: 'string' }
    { name: 'InvoiceNumbers', type: 'string' }
  ]
}

var dataCollectionRuleName =  'A meaningful name for your data collection rule'
var logAnalyticsWorkspaceName = 'The name of your log analytics workspace'
var logAnalyticsWorkspaceResourceId = 'The resource id of your log analytics workspace'
var logicAppStandardPrincipalId = 'The principal id of the managed identity of your logic app standard'

module dataCollectionRule 'modules/data.collection.rule.bicep' = {
    name: 'dcr-[deployment - name]'
    dependsOn: [
      logAnalyticsCustomTable
    ]
    params: {
      CustomTable: customTable
      // Output from DCE module
      DataCollectionEndpointId: dataCollectionEndpoint.outputs.resourceId
      DataCollectionRuleName: dataCollectionRuleName
      LogAnalyticsWorkspaceName: logAnalyticsWorkspaceName
      LogAnalyticsWorkspaceResourceId: logAnalyticsWorkspaceResourceId
      LogicAppStandardPrincipalId: logicAppStandardPrincipalId
    }
  }
The data.collection.rule.bicep
@description('Log analytics custom table object.')
param CustomTable object

@description('Optional location.')
param Location string = resourceGroup().location

@description('Data collection endpoint id')
param DataCollectionEndpointId string

@description('Data collection rule name')
param DataCollectionRuleName string

@description('Log analytics workspace name.')
param LogAnalyticsWorkspaceName string

@description('Log analytics workspace resource id.')
param LogAnalyticsWorkspaceResourceId string

@description('Principal id of the logic app standard managed identity.')
param LogicAppStandardPrincipalId string

resource dataCollectionRule 'Microsoft.Insights/dataCollectionRules@2024-03-11' = {
  name: DataCollectionRuleName
  location: Location
  properties: {
    dataCollectionEndpointId: DataCollectionEndpointId
    streamDeclarations: {
      'Custom-log_${CustomTable.name}_CL': {
        columns: CustomTable.columns
      }
    }
    destinations: {
      logAnalytics: [
        {
          workspaceResourceId: LogAnalyticsWorkspaceResourceId
          name: LogAnalyticsWorkspaceName
        }
      ]
    }
    dataFlows: [
      {
        streams: [
          'Custom-log_${CustomTable.name}_CL'
        ]
        destinations: [
          LogAnalyticsWorkspaceName
        ]
        transformKql: 'source'
        outputStream: 'Custom-log_${CustomTable.name}_CL'
      }
    ]
  }
}
And voila, here you have it, the DCR has been set up. Last thing to do is the role assignment for Logic Apps to be able to use it.
Step 4: Create the Authorization role assignment for you Logic App
This one is quite straight forward. I have put this section in the data.collection.rule.bicep module.
data.collection.rule.bicep
// Create monitoring metrics publisher role in data collection rule for logic apps standard

var monitoringMetricsPublisherRoleId = '3913510d-42f4-4e42-8a64-420c390055eb'
resource monitoringMetricsPublisherRole 'Microsoft.Authorization/roleDefinitions@2022-04-01' existing = {
  name: monitoringMetricsPublisherRoleId
  scope: dataCollectionRule
}

resource monitoringMetricsPublisher 'Microsoft.Authorization/roleAssignments@2022-04-01' = {
  name: guid(
    dataCollectionRule.id,
    LogicAppStandardPrincipalId,
    monitoringMetricsPublisherRole.id
  )
  scope: dataCollectionRule
  properties: {
    roleDefinitionId: monitoringMetricsPublisherRole.id
    principalId: LogicAppStandardPrincipalId
    principalType: 'ServicePrincipal'
  }
}
And with this, everything is in place for your workflow to start using the new approach!
Important things to keep in mind with DCR
There are some limitations to a single DCR, which I’d like to point out.
1) Data Collection Rule can support a maximum of 10 custom log analytics tables. This means if you are using more than 10 tables for logging, you will need multiple DCR’s.
2) Stream names in a DCR must start with Custom_. (which is 7 characters, see next point).
3) There is a limitation on the number of characters that you can use for a DCR stream name, which is 52. My assumption is that this is due to the 45-character limitation in a name for a custom table in Log Analytics. If you apply the 7 characters of the previous statement, it is a total of 52.
Step 5: Final step – Start using the DCE / DCR from a Logic Apps workflow
Now that everything is in place, the final step is to adjust your workflows to use the new approach by using an HTTP request action.
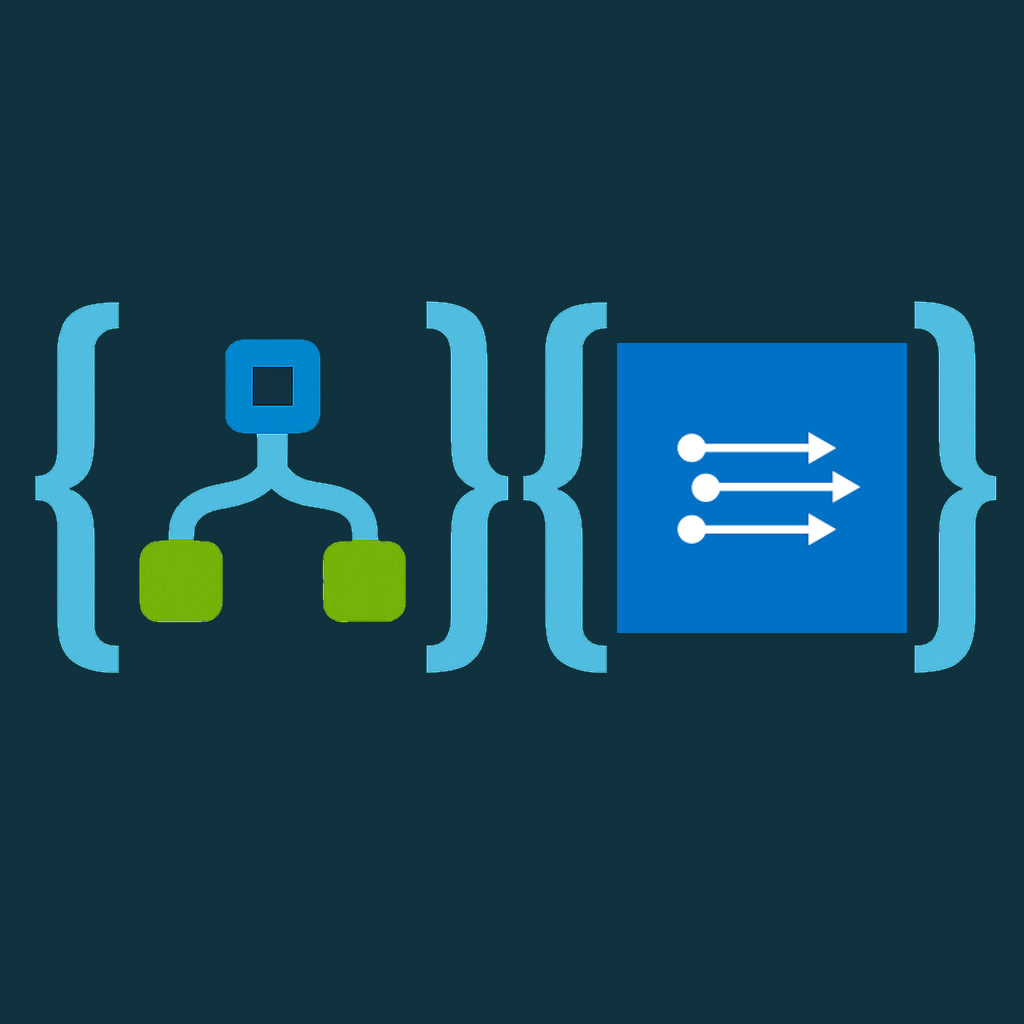
So, what we want to do is move from this action:

To this action:

First, you will need to start off with replacing the Send Data action with the HTTP Request action. If you look at the workflow.json under the hood, you will see opportunities to write some .NET code to do all of this for you and save you a lot of time in manually editing every workflow that uses the action. I did, it saved me a lot of time, but it is out of scope of this post. Instead, I will explain what needs to be done to successfully send data to a custom Log Analytics table.
1) The URL. You will need to send your tracked properties / log data to the correct URL. This URL has the following format:
https://[ingestion url of the data collection endpoint]/dataCollectionRules/[immutable id of your data collection rule]/streams/[name of the stream in the data collection rule]?api-version=2023-01-01
- Ingestion URL of the data collection endpoint can be found on the overview page of the DCE (or retrieve it via bicep)

- Immutable id of the data collection rule can be found on the overview page of the DCR (or retrieve it via bicep)

- Name of the stream is the name of the stream declaration in your bicep -> Custom_[custom table name]_CL. It can also be found under data sources in the DCR.
2) The HTTP action. It simply is a POST.
3) Header should contain a Content-Type of application/json.
4) Body is the information that you want to send to the custom table. An important difference with the Send Data Action is that the original request is wrapped in a JSON array.
5) Authentication is straightforward. Use the system assigned managed identity of your Logic Apps and set the audience to https://monitor.azure.com.
That’s it! If everything is in place, you should see data coming in your custom table.

Conclusion
The impact of the Log Analytics Data Collector API being deprecated will be big. I imagine that many integrations across organizations are using this approach to log custom data to Azure Log Analytics. with Logic Apps.
It therefore is important to move away from the “Send data” action in Logic Apps to the new recommended approach for ingestion of data to Log Analytics.
The impact of this change is big, and there currently isn’t an easy way to switch. By sharing my experience, I hope that anyone that is facing this challenge will have a easier and smoother transition towards the Azure Monitor Log Ingestion API before 14th of September 2026. If you know that to do, it’s not that difficult…only labor to get there!
Leave a Reply